Life Quality Index

Almanac: History & Mathematics:Political, Demographic, and Environmental Dimensions
DOI: https://doi.org/10.30884/978-5-7057-6354-2_04
Abstract
It is quite natural that in the current global transition fr om the ‘era of growth’ to the ‘era of stability’, the importance of qualitative changes in all spheres of life is increasing. It is indicators of the quality of life in different countries of the world that play an important role among the indicators characterizing these changes. Quality of life depends on material, social and psychological factors. Taking into account the existing approaches to determining the quality of life, the authors make an attempt to create an integrated index that considers both subjective (psychological) and objective aspects of its assessment. The idea that the higher the quality of life, the more basic material, social, and spiritual needs are met, is used as a methodological basis for the construction of the index. When constructing the index, Malkov et al. use Maslow's theory of the ‘pyramid’ of needs (the first, basic, hierarchical level within the ‘pyra-mid’ is physiological needs, the last level is the need for self-actualization). For each type of needs, indicators characterizing the degree of their satisfaction (or, conversely, dissatisfaction) have been selected. The paper contains a description of the methodology used and some calculation results.
Keywords: quality of life, subjective wellbeing, indicators of development, hierarchy of needs.
Currently there is a global transition fr om the ‘era of growth’ to the ‘era of stability’ (though this is a long way). Accordingly, if until now, when analyzing world dynamics, the main attention has been paid to the indicators reflecting the growth rates of economic, demographic and other characteristics (e.g., GDP growth rates), at present the indicators reflecting qualitative characteristics, in particular the quality of life, come to the fore (see Akaev et al. 2023; Malkov et al. 2023).[1]
The quantitative assessment and comparative analysis of the quality of life of the population in different countries of the world are an urgent and very difficult task. This is due to the fact that there is still no generally accepted understanding of what this concept includes. A description of the existing approaches to assessing the quality of life is provided in some of our previous publications (Malkov et al. 2019; Musieva 2019). Based on the results of the analysis, it was revealed that the methods used and the indices calculated on their basis do not provide a full assessment of the quality of life of the population in various countries. These include, for example, the life quality indices calculated by The Economist analysts, the International Living Legatum Prosperity Index, and the well-known Human Development Index (HDI). Each index is unique and requires special consideration, but a common disadvantage for all of them is insufficient consideration (as in the case of The Economist, Legatum Prosperity Index), or the absence (in other cases) of indicators that take into account the cultural aspects of people's lives, their spiritual and psychological condition. For this reason, there is a paradoxical situation: according to the Happiness Index, which is compiled on the basis of sociological surveys of the population of various countries of the world (Veenhoven 1995, 2020) the citizens of island or other poor countries are in the first positions (Vanuatu, Costa Rica), while developed countries with strong economic indicators lag behind, although they are leaders in the indices mentioned above. This means that in order to reveal the completeness of the idea of the quality of life, it is necessary to find additional parameters that will eliminate the existing shortcomings in the estimates.
Taking into account the existing approaches to determining the quality of life, an attempt has been made to create an integrated index that takes into account both subjective (psychological) and objective aspects of its assessment. The development of this index is largely based on the work of Malkov and Lyubovikova (2014). The idea that the higher the quality of life, the more basic material, social, and spiritual needs are met, has been used as a methodological basis for the construction of the index. To determine the fundamental needs, Abraham Maslow's (1970) theory is used, on the basis of which the following hierarchy / ‘pyramid’ of needs is identified:
1. Physiological needs;
2. The need for security;
3. Love, communication, belonging to a social group;
4. Respect, recognition, prestige;
5. Self-expression, creativity;
6. Self-actualization.
For each type of needs, we have selected indicators characterizing the degree of their satisfaction (or, conversely, dissatisfaction).
The first level of the ‘pyramid’ is physiological needs, which consist in the needs for food, water, reproduction, etc., that is those whose satisfaction is necessary for each person in the first place. To characterize this group of needs, the indicators of infant mortality and life expectancy were chosen. As important indicators, they reflect the possibility of full-fledged human existence. Infant mortality was chosen as an indicator due to the fact that the survival of newborn children directly depends on the conditions and quality of life in the country of residence of their parents, as well as on the state of health care. Life expectancy at birth is one of the basic characteristics in modern socio-economic, demographic studies. Life expectancy at birth is the average number of years a newborn should live if, at each age, the conditions for maintaining his or her life were hypothetically the same as those for the corresponding age group in the year of birth. It characterizes various social subsystems – the health care system, the social security system, etc., and also evaluates the effectiveness of the administrative apparatus of the state and its social policy. There is a direct relationship between life expectancy and the life quality index, while the infant mortality rate is inversely proportional to the life quality index.[2] The source of data for these indicators is the World Bank database, within the framework of the indicators of the Sustainable Development Goals.
To characterize the second level of the ‘pyramid’ – the need for security – the following indicators are used: the number of premeditated murders, as well as mortality fr om environmental pollution. These indicators reflect the presence of threats to human life both fr om the direct actions of other people and from environmental pollution. Ensuring security is one of the fundamental tasks of the state, without which human existence is also impossible. In this case, it implies the presence of security from deliberate killings, as well as from deadly effect of environmental pollution. Since both indicators reflect the level of insecurity in the country, there is an inverse relationship between them and the life quality index. The source of statistical data is the World Bank database within the framework of the Sustainable Development Goals indicators, as well as data from the American Institute for Health Metrics and Evaluation (IHME).
The third level of the ‘pyramid’ of needs includes the needs for love and communication. Needs of this kind are best realized in the family, that is when people marry and start their own families wh ere there is love, care, joint activities and, of course, a sense of belonging to the family. In most cases, divorced or single individuals do not feel satisfied with their lifestyle and seek to start a family. In view of this point, the indicator of registered marriages and divorces was chosen to characterize this need. The source of the statistical data is the UN Database.
The fourth level of Abraham Maslow's hierarchy of needs includes the need for respect, personal achievements and recognition from others. The quality of life is directly related to the satisfaction of this need, however, both in international and national statistics it is difficult to find an indicator that would characterize the satisfaction of the need for respect. As mentioned above, recognition can be achieved through the activities in different categories. To characterize the success / failure of a person's labor activity, the following indicators were chosen: the intensity of doing business and the unemployment rate. Each specific person needs to have confidence in the future, in the fulfilment of their abilities, in the ability to financially provide for themselves and their families. The fulfilment of this need can be characterized by the indicator of the intensity of doing business. However, the possibility to meet this need largely depends on the state of the labor market, an indicator of which is the unemployment rate. Unemployment is a negative factor, so there is an inverse relationship between its level and the life quality index. The sources of statistical data are the World Bank database within the framework of the indicators of the Sustainable Development Goals.
At the fifth level of Abraham Maslow's ‘pyramid’ there is a need for self-expression and creativity. An indicator of how many people in a society are engaged in creative activities is the number of researchers, as well as mean years of schooling, since the ability to engage in creative activities depends on the level of education. Usually, indexes use only the number of years of education, which cannot fully reflect its quality. The latter seems to be a rather difficult task based on the available statistical data, since either there are no relevant indicators or data are not available for all countries. Determining the number of researchers allows identifying, in general, the interest in knowledge among citizens, as well as the desire of the state to develop the field of science. Thus, these indicators together will make it possible to assess both the level of education in the states and its quality. The main source for this indicator was the statistics of the World Bank within the framework of the Sustainable Development Goals indicators, as well as the UNESCO database.
At the last level of the hierarchy of needs, there is the need for self-actu-alization. An indicator of the security of this need is the extent to which people are satisfied with their lives and consider themselves to be happy. This is an integrative and subjective assessment. It is reflected by the so-called Happiness Index, determined on the basis of sociological surveys of representative samples of the population in various countries of the world (Veenhoven 2020). It characterizes satisfaction with personal life, social relations, environment, state of affairs in the country. Another integrative indicator reflecting the subjective perception of the quality of life is the suicide rate. This is an anti-indicator reflecting the state of the social climate in the country. It is confirmed by the results of an empirical study by Emile Durkheim (1897[1951]), who was one of the first to establish the relationship between modernization and the growth of deviant behavior. The source of statistical data for determining these indicators is the happiness survey data posted on the World Happiness Database website (this is a database developed at the Erasmus University Rotterdam and based on surveys of the population of more than 150 states (Ibid.), as well as data on the number of suicides from the World Bank database.
If the indicators proposed for the calculation of the life quality index are presented in data sources in absolute terms, then they are reduced to a specific form (per 100,000 people), which makes it possible to compare countries by the value of each of the selected indicators.
The process of forming an integral index of quality of life consists of the following successive stages:
a) unification of the values of indicators. Before calculating the life quality index, it becomes necessary to unify the values of the indicators, because they differ both in units of measurement and in the spread of numerical values. There are both direct and inverse correlations between the value of individual indicators and the quality of life, that is for some indicators, the lowest value of the indicator will correspond to the best quality of life, for others – the highest. The unification of indicators is a transformation of their values, as a result of which their new values will be in the interval from 0 to 1. Thus, ‘1’ will be equal to the best value of the indicator in relation to the quality of life in the sample of countries under consideration, and zero will equal the worst. Taking into account the fact that the values of indicators and the life quality index can be directly and inversely proportional to each other, their unification is carried out using the following formula:
if the best indicator corresponds to its maximum value:
.png) , (Eq. 1)
, (Eq. 1)
if the best indicator corresponds to its minimum value:
.png) (Eq. 2)
(Eq. 2)
wh ere .png) – unified data;
– unified data;
.png) – initial data (the value of the considered indicator for the country);
– initial data (the value of the considered indicator for the country);
.png) – the maximum value of the indicator for the considered sample of countries;
– the maximum value of the indicator for the considered sample of countries;
.png) – the minimum value of the indicator for the considered sample of countries.
– the minimum value of the indicator for the considered sample of countries.
Unification of the measurement scale of indicators allows solving the problem of quantitative incompatibility of changes in different variables, as well as the problem of multidirectional measurements ‘for the better’;
b) formation of an integral index of quality of life based on multiplicative convolution. The integral life quality index is formed on the basis of a multiplicative convolution, which involves the multiplication of all indicators. It should be noted here that often the development of the life quality index in other works was an additive convolution in which particular indicators were added up. However, the experience of using such indices has shown that additive convolution has certain disadvantages. In particular, according to the meaning of such a convolution, the satisfaction of each need can be fully compensated by any other need (e.g., a low level of security can be fully compensated by a high level of satisfaction of physiological needs), which is not true. When using an additive convolution, it turns out that a country that has the worst scores on a number of indicators can compensate for this by having the best scores on other variables (e.g., if the country has an extremely high level of pollution, but the material well-being of the population is at a high level, then the index will show that the quality of life in the country is high). Multiplicative convolution is devoid of such shortcomings. When using it, only the country, all indicators of which are at a high level, will have a high quality of life.
Due to the fact that the life quality index is a multiplicative convolution, it is advisable to transfer the values of the indicators from the interval (0; 1) to the interval (2; 3) (by simultaneously increasing the values of all unified indicators by two units) and then to calculate the logarithm of the result.[3]
In accordance with the above, the calculation of the integral index of quality of life was carried out according to the following formula:
.png) (Eq. 3)
(Eq. 3)
wh ere LQI is the value of the life quality index in the country under consideration;
k – the number of indicators that determine the level of quality of life;
.png) – the value of the indicator weight;
– the value of the indicator weight;
.png) – the unified value of the indicator after calculating its logarithm.
– the unified value of the indicator after calculating its logarithm.
An important problem is to determine the weight (significance) of each indicator when calculating the life quality index. Usually, these weights are determined on the basis of sociological research or by expert opinion. In this version of the integral index, it was assumed that the satisfaction of all the needs of Abraham Maslow's ‘pyramid’ is equally important for people, regardless of the country in which they live. Taking into account the fact that each need in the integral index is represented by the same number of indicators (namely, two indicators), each indicator was assigned a unit weight.
Below are some results of the calculation of the life quality index (LQI) according to the method described. The figure shows the results of calculating the LQI index for a number of countries that are included in the Group of Twenty (G20), which consists of the largest economies in the world and includes both developed and developing countries. It should be noted that, according to the logic of its structure, the index is designed to reflect comparative characteristics in relation to the countries included in the index rather than absolute value of the quality of life in a given country.
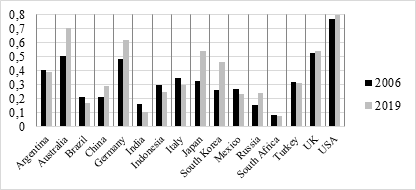
Fig. LQI values in 2006 and 2019 for some G20 countries
The figure shows that the LQI value in the period under review was growing in such countries as Australia, China, Germany, Japan, South Korea, Russia, the United Kingdom and the United States, while the rest of the countries presented in the histogram show a relative decrease in the value of the index.
LQI calculations allow ranking the world's countries in terms of quality of life. By using the index, it is possible to find out exactly what changes in indicators led to an increase or decrease in the overall rating of the country in question. For example, the rise of Russia's rating in the life quality index from 46th to 38th place in 13 years (from 2006 to 2019) is associated with an increase in such indicators as life expectancy and happiness index, as well as with a decrease in such indicators as unemployment rate, the number of deliberate and premediated murders, or the number of suicides. Almost similar indicators caused the growth of the index value in 2019 in other countries.
A comparison of the ratings obtained on the basis of the developed LQI and the Human Development Index (UNDP 2022) as well as the Legatum Institute Prosperity Index (Legatum Prosperity Index 2021) showed that the LQI has a fairly high level of correlation with these most famous indices widely used in international practice. It is closest to the Legatum Institute Prosperity Index (R2 = 0.736), which uses more than 90 indicators and survey results covering different aspects of life of the population[4], while the LQI is more transparent, since its indicators are clearly tied to the specific needs of people.
It should be noted that the LQI, like other life quality indices, is only the beginning of an important work on creating a system of indicators that meets the challenges of the coming historical era, when quality characteristics become a priority over those of extensive growth.
Acknowledgement
This research was performed according to the Development Program of the Interdisciplinary Scientific and Educational School of Lomonosov Moscow State University ‘Mathematical methods of analysis of complex systems’.
References
Ahmad E., Drèze J., Hills J., and Sen A. 1991. Social Security in Developing Countries. Oxford Scholarship.
Akaev A., Malkov S., Grinin L., Bilyuga S. et al. 2023. Modeling Social Self-Organization and Historical Dynamics. Modern Society and a Look into the Global Future: Cybernetic W-Society. Reconsidering the Limits to Growth. A Report to the Russian Association of the Club of Rome / Ed. by V. Sadovnichy et al., pp. 419–460. Springer.
Banerjee A. V., and Duflo E. 2019. Good Economics for Hard Times. Allen Lane.
Colman R. 2022. What Really Counts: The Case for a Sustainable and Equitable Economy. Columbia University Press.
Costanza R., Kubiszewski I., Giovannini E., Lovins H. et al. 2014. Development: Time to Leave GDP Behind. Nature News 505(7483): 283–285. https://doi.org/10.1038/505283a
Durkheim E. 1897[1951]. Suicide: A Study in Sociology. Routledge.
Easterlin R. A. 2010. Well-Being, Front and Center: A Note on the Sarkozy Report. Population and Development Review 36(1): 119–124. https://doi.org/10.1111/j.1728-4457.2010.00320.x
Goldsmith C. 2019. Why GDP is No Longer the Most Effective Measure of Economic Success. World Finance July 25. https://www.worldfinance.com/strategy/why-gdp-is-no-longer-the-most-effective-measure-of-economic-su....
Grinin L., and Grinin A. 2021a. Analyzing the Global Problems of the Twenty-First Century. A Review and Forecast Based on the Report to the Club of Rome ‘Come On!’ Journal of Globalization Studies 12(2): 181–195. https://doi.org/10.30884/jogs/2021.02.10
Grinin L., and Grinin A. 2021b. Reflections on the Economic Growth and Future. Article 1. Globalism vs GDP Growth and ‘the Decline of the West’. Filosofiya i obshchestvo 3: 5–34. In Russian (Гринин Л., Гринин А. Размышления об экономическом росте и будущем. Статья первая. Глобализм vs рост ВВП и "закат запада". Философия и общество 3: 5–34). https://doi.org/10.30884/jfio/2021.03.01/
Grinin L., and Grinin A. 2021c. Reflections on the Economic Growth and Future. Article 2. Globalization and Economic Growth. Filosofiya i obshchestvo 4: 5–38. In Russian (Гринин Л., Гринин А. Размышления об экономическом росте и будущем. Статья вторая. Глобализация и экономический рост. Философия и общество 4: 5–38). https://doi.org/10.30884/jfio/2021.04.01
Grinin L., Grinin A., and Korotayev A. 2023. Global Aging – an Integral Problem of the Future. How to Turn a Problem into a Development Driver? Reconsidering the Limits to Growth. A Report to the Club of Rome / Ed. by V. Sadovnichy et al., pp. 117–135. Springer.
Grinin L., Grinin A., and Malkov S. 2023a. Economics. Optimizing Growth. Reconsidering the Limits to Growth. A Report to the Club of Rome / Ed. by V. Sadovnichy
et al., pp. 155–168. Springer.
Grinin L., Grinin A., and Malkov S. 2023b. Sociopolitical Transformations: A Difficult Path to Cybernetic Society. Reconsidering the Limits to Growth. A Report to the Club of Rome / Ed. by V. Sadovnichy et al. pp. 169–189. Springer.
Kapoor A., and Debroy B. 2019. GDP Is Not a Measure of Human Well-Being. Harvard Business Review 10. URL: https://hbr.org/2019/10/gdp-is-not-a-measure-of-human-well-being.
Legatum Prosperity Index. 2021. Key Findings of the Legatum Prosperity Index. URL: https://www.prosperity.com/feed/key-findings-2021-prosperity-index.
Malkov S., and Lyubovikova D. 2014. Life Quality Index as an Indicator of the Development of Society and the State. Informatsionniye voiny 2(30): 48–52. In Russian (Малков С., Любовикова Д. Индекс качества жизни как показатель развития общества и государства. Информационные войны 2(30): 48–52).
Malkov S., Bilyuga S., and Musieva J. 2019. Methodology for Cross-Country Assessment of Quality of Life Based on the LQI index. Informatsionniye voiny 4(52): 38–44. In Russian (Малков С., Билюга С., Мусиева Д. Методика межстрановой оценки качества жизни на основе индекса LQI. Информационные войны 4(52): 38–44).
Malkov S., Grinin L., Grinin A., Musieva J., and Korotayev A. 2023. Modeling Social Self-Organization and Historical Dynamics. Global Phase Transitions. Reconsidering the Limits to Growth. A Report to the Club of Rome / Ed. by V. Sadovnichy et al., pp. 387–417. Springer.
Maslow A. H. 1970. Motivation and Personality. 2nd ed. Harper and Row.
Masood E. 2021. GDP: The World's Most Powerful Formula and Why It Must Now Change. Icon Books.
McElwee S., and Daly L. 2014. Why We Should Abolish the GDP. Washington Post June 5. URL: https://www.washingtonpost.com/posteverything/wp/2014/06/05/why-we-should-abolish-the-gdp/.
Musieva J. 2019. The Concept of ‘Quality of Life’ and Approaches to Its Definition. Informatsionniye voiny 3(51): 16–20. In Russian (Мусиева Д. Понятие «качество жизни» и подходы к его определению. Информационные войны 3(51): 16–20).
ul Haq M. 1995. Reflections on Human Development. Oxford University Press.
UNDP (United Nations Development Programme) 2022. 2022 Special Report on Human Security. UN.
Veenhoven R. 1995. World Database of Happiness. Social Indicators Research 34: 299–313.
Veenhoven R. 2020. Happiness in Nations. World Database of Happiness. Rotterdam: Erasmus University. URL: http://worlddatabaseofhappiness.eur.nl/hap_nat/nat_fp.ph
p?mode=1.
* This research has been implemented with the support of the Russian Science Foundation (Project № 23-11-00160)
[1] The GDP indicator is often subjected to generally fair criticism (see, e.g., Easterlin 2010; Costanza et al. 2014; McElwee and Daly 2014; Goldsmith 2019; Kapoor et al. 2019). However, sometimes criticism is mainly intended to hide the fact that the potential of developed states has weakened (for more details see Grinin and Grinin 2021a, 2021b, 2021c). On economic growth and its perspectives see Grinin, Grinin, and Malkov 2023a. The development of the indicators that would be capable of replacing GDP is underway (see, e.g., Ahmad et al. 1991; ul Haq 1995; Banerjee 2019; Masood 2021; Colman 2022).
[2] On relationship between life expectancy and quality of life see also Grinin, Grinin, and Korotayev 2023; Grinin, Grinin, and Malkov 2023b.
[3] In principle, other methods of transforming unified data are also possible, but as further studies have shown, they have little effect on the final comparative assessments of the quality of life in different countries.
[4] Unlike the Legatum Prosperity Index, the HDI includes only three indicators, which, in our opinion, is clearly not enough to assess the quality of life.