A Survivorship Pattern of Civilizations and Its Consequences

Almanac: History & Mathematics:Political, Demographic, and Environmental Dimensions
DOI: https://doi.org/10.30884/978-5-7057-6354-2_06
Abstract
Biological entities, particularly cohorts of individuals and, as will be suggested in this paper, entities above the level of the individual and including that of civilization also exhibit characteristic survivorship. It will be demonstrated that a cohort of civilizations existing between 3000 BCE and 1000 CE exhibit Type I survivorship. Further, the consequences of that mode of survivorship will be discussed, including the potential for further survival with respect to a given civilization age. The significance of civilization half-life, the energy relationships with respect to civilization age, and the relationship between Type I survivorship and changes in urban distribution characterized by the periods of stasis and punctuation exhibited by the population of maximum urban areas will also be discussed. Some attention will be given to transitions fr om stasis to punctuation and vice versa with respect to survivorship mode.
Keywords: civilizations, survivorship pattern, civilization lifespan.
Introduction
That civilizations originate, exist in some form for a period of time, and then either expire slowly or collapse is an unstartling statement; archeology is replete with such evidence. Rome, at least the Classic Maya of the tropical lowlands of the southern Peten, the Inca, and the Khmer polities of Angkor Wat and Angkor Thom all collapsed, while the position of France, once the dominant power in Europe, now occupies a reduced rank on the world stage, as do the Dutch and British; their reduced prominence a consequence of a much slower process of decline than, say, of the Inca. In general, polities have a lifespan, some longer than others, but most can be perceived of as having an origin, a relatively stable middle, and an ending; a clear model of historical narrative. Previous civilizations, at least fr om the perspective of temporal depth, can be considered to have (relatively) discrete lifespans and may be considered for their discreteness as single entities. It follows that multiple civilizations can be considered collectively as populations of entities of varying lengths of existence, that is as cohorts. The concept of survivorship as it is understood in population ecology may then be a useful one to apply to the analysis of human civilizations.
Survivorship as a concept has been a useful tool in population ecology for quite a number of decades. This concept may be best described by considering a cohort of conspecific individuals synchronously beginning their existence and being monitored over time until the last individual expires. A graph may then be constructed in which the Y-axis represents by some measure the number of individuals remaining in the cohort, for example at t = 0 the cohort will have its maximum number and there afterwards will be reduced by the number of individuals expired until, at the final time, there are no more individuals remaining. By graphing the log-transformed values of cohort size, a method preferred by demographers in general, per time, a survivorship curve can be generated. It turns out that, broadly speaking, there are three modes of survivorship, and these three different styles of dying have been given the labels: Type I, Type II, and Type III survivorship patterns (see Fig. 1). Please note here that the general forms of each of the types of survivorship are a result of their underlying biology. Type I organisms have low juvenile rates of mortality, Type II organisms die at a rate that is independent of age, and Type III organisms have very high juvenile mortality. Interestingly with respect to Types I and III, mature and aging adults expire at a rate opposite of the rates of juveniles; that is to say that aging Type I individuals have a low probability of continued survivorship, while Type III senior citizens have an increased probability of survivorship.
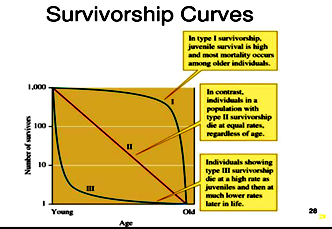
Fig. 1. Survivorship curves
What follows may seem like arcane population ecology to the unschooled eye, however, three standard works in this area, and there are many, have been included to aid in understanding what the population ecology concepts are all about. The works of Gotelli (2008), Hutchinson (1978) and Wilson and Bossert (1971) are given here as references that are particularly accessible. It has also become the habit of population ecologists to label Type III species as r-species and Type I species as K-species, taking the labels fr om the Verhulst-logistic equation as follows:
dN/dt = rN(1 – N/K), (Eq. 1)
wh ere r = growth rate, N = population size, and K = carrying capacity, i.e. some upper limit above which sustained existence of a given population is impossible. K-species have high rates of survivorship (at least to reproductive maturity) and low rates of reproduction, while r-species are the reverse, having high rates of reproduction and low rates of survivorship. Pertinence to this paper requires that one further point needs to be emphasized about these demographic distinctions. That Type I individuals have a reduced probability of continued survivorship in old age when applied to a cohort of civilizations would seem to imply, if and only if civilizations exhibit Type I survivorship, that aging civilizations have a low probability of continuing their existence.
What does the previous discussion have to do with the lifespans of civilizations? If a collection of different civilization lifespans can be accumulated and if those civilizations existed under relatively similar conditions, say, of energy acquisition, then this collection of civilizations may be considered as a cohort and the fiction of their all originating at the same time may be indulged in. Therefore, this data set of civilizations may be treated in the same way as a cohort of individuals and their survivorship can be represented graphically. The specific processes for graphical preparation will be discussed in the next section.
Luke Kemp (2019) has published lifespan data for ancient civilizations (see also Bardi 2019, and for a preliminary recalculation of data see Linotte 2020). The time over which the data were collected extends fr om 3000 BCE to 1000 CE, a period of time over which there were only agrarian civilizations; this implies a similar energy source for al civilizations represented, although surpluses of this energy source used may vary in magnitude. It is important to note that urban area formation is directly associated with civilization existence and therefore with agrarian surplus generated. However, not all civilizations of the time period being considered had significant urban areas; steppe nomads fall into this last category. Even so, the steppe nomad civilizations did depend on civilizations that were urbanized (for a correction of the Kemp data see Linotte 2020).
A comment should be made at this point regarding the relationship between the magnitude of energy accessible to a given civilization and the degree of urbanization associated with that particular civilization. The pattern of urbanization over the last 5,000 years has been investigated by Harper (2017) as represented by the size of the maximum urban area for the world-system as a whole, that is the globe in toto, over that period of time. This maximum urban area pattern of sizes (with respect to population) over this period of time is punctuated in the form revealing periods of stasis separated by periods of rapid maximum urban area growth. It is the contention here that these maximum urban area magnitudes are a consequence of the limits to energy availability, and, as these sizes are characteristic of the entire world-system, apply to all civilizations extant at a given time. Therefore, individual civilizational characteristics, while indicative of a given civilization, are not determinants per se of maximum urban area limits; those limits are most probably characteristic of underlying Homo sapiens biology.
If the level of accessible energy is characteristic of global maximum urban area magnitude, then the range of change over this 4,000-year period is worth considering; it is by a factor of 30 that the maximum urban areas change. However, over the majority of the time this maximum urban magnitude is stable or oscillates around a mean value, the implication being that energy access over periods of maximum urban area stasis is relatively constant as well, that is the same mechanisms of energy access are in play for the duration of the period of stasis. The telling point, I believe, will be the goodness of fit of empirical data both to the expected curve form and to any math model constructed to represent the curve displayed.
There is one more item: as mentioned earlier, H. sapiens is a K-species. Does this or should this imply that the survivorship pattern of the civilizations comprising the cohort should also represent a Type I curve? It is the working hypothesis of this paper that human civilizations exhibit Type I behavior and is so proposed as a result of parsimony. While a math model has been constructed and is presented later in this paper, it is done so for symbolic reference and has yet to be tested. It is a focus for future research.
Materials and Methods
The data fr om Kemp (2019) have been organized fr om shortest lived to most long-lived giving a total population of N = 87. Based on the longest surviving civilization of this cohort, t = 1150 years, the X-axis has been divided into 50-year increments, and the cohort binned into those surviving per 50-year increment, the magnitude of each bin being reduced by the number of civilizations no longer in existence up to that point. At t = 0 all civilizations were in existence, and at t = 1200 no civilizations were extant. The binned data were log-transformed using logarithms of the base e. The graphical axes will then be: the X-axis represents lifespan I years and is a linearly scaled axis, while the
Y-axis is the log-transformed number of extant civilizations at any given time.
A graph of the rank-order arrangement of Kemp's data has also been constructed fr om longest to shortest lifespan with the intent of demonstrating the effects of self-organization on the distribution of civilization lifespans. Harper (2020) in the study of the rank-order distribution of the duration of reigns during the period in which Al Andalus, the Islamic residence in the Iberian Peninsula from 715 CE to 1492 CE occurred, shows that both linear distributions of reign lengths (and also Taifa durations during the period of civil war) and non-linear Zipf-Pareto-like distribution occur (Zipf 1949[2012]). In the Results section the graphs of rank-order distributions will be presented first followed by the actual survivorship data.
A math model of Type I survivorship has been constructed:
Yt = Yo(1 – at^(bt^c)), (Eq. 2)
in which t = time in years, Yt = lnNt, Nt = cohort size at any time beyond t = 0, No = initial cohort size, and a, b, and c are fitted constants. The term, at^(bt^c), was constructed so that greater lifespan would be discounted at a higher rate at older ages. In distinction, were a Type III curve to be modeled, this time by a power function, for example:
Yt = aYob, (Eq. 3)
wh ere b < 0, then, as this function has a fat tail, the implication being that there is a greater probability of survival by older members of the cohort.
One should note that all graphs were constructed with the free software, SciDAVis, and all calculations were done with a TI-84+ calculator.
Results
As mentioned in the previous section, the rank-order distributions will be dealt with first in order to establish the fact that this data exhibit pattern, that is order, with respect to the alternative, randomness. [The first three graphs have an X-axis representing the rank of any given civilization, and a Y-axis representing civilization lifespans.] In Fig. 2 it is quite clear that the rank-order distributions of civilization lifespans are non-linear.
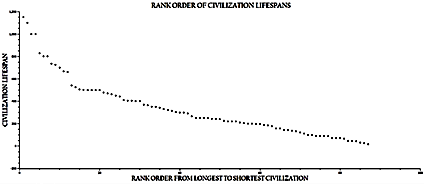
Fig. 2. The X-axis represents rank order, and the Y-axis represents the lengths of civilization lifespans. Note that this distribution of points is non-linear
This is demonstrated more clearly in Fig. 3. This graph has fitted to the distribution of points in Fig. 2 a first degree decay curve with the regression equation:
Y = 58.5787 + 991.5422exp(–X/25.7059), (Eq. 4)
and having a coefficient of determination of R2 = .9885. However, it should be noted that the tail of this distribution beginning at 577 years and extending to the final civilization listed, the Qin Dynasty, at 14 years, is linear (see Fig. 3). This is confirmed by imposing a linear regression on this distribution yielding the following equation and coefficient of determination:
Y = 594.6916 + 6.8058. R2 = .9960; (Eq. 5)
axes as defined previously. Unquestionably this distribution is linear, and the significance of this linearity will be addressed in the Discussion.

Fig. 3.
This is the same set of defined axes as in Fig. 1 but with a fitted exponential decay function: Y = 58.5787 + 991.5422exp
(–X/25.7059), R2 = .9885
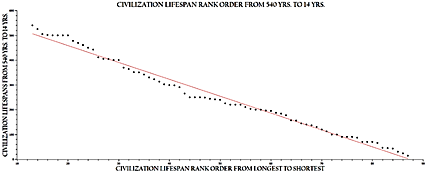
Fig. 4. The X-axis is shortened to represent the range of rank order data that represent the linear portion of the distribution in Fig. 1. The imposed linear regression is Y = 594.6916 – 6.8058X, R2 = .9960
The remaining three graphs are actual survivorship curves. Fig. 1 represents a generic presentation of the three main types of survivorship curve. There are several points to be noted here. First, the Y-axis is log-transformed. This is standard procedure, as it distinguishes clearly between Type I, II, and III curves. Type II, in particular, has an obvious intermediate position between Types I and III. Second, juvenile survivorship is clearly represented: Type I having the highest juvenile survivorship, Type II having constant survivorship throughout, and Type III having the lowest juvenile survivorship. Finally, in Type I survivorship being long-lived implies that the probability of continuing a long life is reduced; the opposite is true for Type III which may be represented by a power function that has fat tails, and this implies that older aged individuals have a relatively high probability of continuing their existence. This will be discussed within the context of civilization lifespans in the next section. (For a lucid explanation of the significance of the different types of survivorship curves, see any basic text on population biology [e.g., Gotelli 2008; Hutchinson 1978; and Wilson and Bossert 1971]). Note that Hutchinson has a particularly effective explanation of survivorship as a function of modes of death. Also, it is the position here that civilizations may be treated like any other biological entity with respect to patterns of survivorship, as they are a function of the collective interaction of different levels of biological organization from the individual through different levels of complexity to the civilizations being investigating here. The reference to Deevey (1947) is also included, as this research demonstrates how life tables, used to construct survivorship among other demographic parameters may be constructed from field data.
Fig. 5 is constructed with a linear Y-axis, while it has a natural-log-transformed Y-axis. The graph represented in this figure has a clear Type I configuration and is presented to show that the unmodified nature of the data belongs to the Type I category.
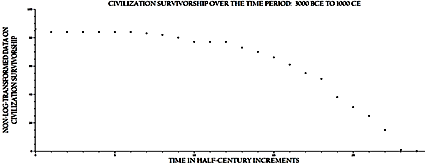
Fig. 5. The X-axis represents time in half-century increments, and the Y-axis represents non-log-transformed civilization lifespans. This graph is presented to show that the Type I form of graph is embedded within the unaltered data
Fig. 5 shows the survivorship pattern with a long-transformed Y-axis and exhibits a Type I form; a significant portion of this curve shows little mortality. However, beyond the log-transformed point, (19, 3.6) population loss is significant. While the half-life of this distribution is approximately 840 years, the total time to the extinction of this cohort is 1150 years.
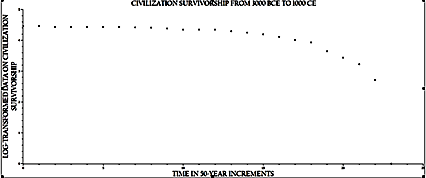
Fig. 6. The X-axis is scaled as in Fig. 5, but the Y-axis is natural-log-transformed as is traditional when presenting survivorship data. Note that there is little change in the position of the data until Time ~ 20 half centuries; then the distribution drops precipitously
Discussion
The fundamental questions of this paper are: Do civilizations exhibit a survivorship pattern, and, if so, what is it? The importance of these questions rests not just in a simple answer, yes or no and then specifying the type of survivorship, but also in the implications of those answers for the understanding of historical patterns writ large. That civilizations have a specific pattern of survivorship, and this based on the original thinking of population biologists, that is Types I, II, or III (see the Results section for an explanation of these survivorship categories), and the implications of those patterns for a given species, for example r-species or K-species, species that have as their primary strategy prolific reproduction with little parenting or reduced reproductive rates but with significant parenting, or some mix thereof, will very clearly allow relationships to be investigated at the macro-level of world-system functioning, relationships with respect to energy expenditure and, for example, system limits. However, in order to address the results of this paper, the conditions under which ecological concepts can be applied to the behavior of human civilizations need to be described. (If there is confusion on any of the above, I would encourage the reader to refer to the previously mentioned population ecology references.)
When survivorship pattern is being established, and this can be done in various ways (see Deevey 1947), a cohort needs to be established and then followed through time either prospectively or retrospectively until all members of the cohort have expired or gone extinct. Can the collection of civilizations used in Kemp's paper be described as a cohort? I believe the answer is yes and for the following reasons:
1. All the civilizations in Kemp's study are preindustrial and share a segment of human history in which, while technological improvements occurred, for example improved mechanisms of transport, improved material used, for example copper to bronze to iron, and farming techniques improved, for example the use of irrigation and the water wheel, the fundamental energy source supporting these civilizations did not change; agricultural surplus was the primary fuel on which the rest of civilization depended on during the period, 3000 BCE to 1000 CE.
2. That agricultural surplus placed a lim it on the complexity and therefore the longevity of civilizations can be seen with regard to the extended periods of stasis for maximum urban areas existing during Kemp's proscribed period of time, from 3000 BCE to 1000 CE.
While there are two periods of (relative) stasis during these 4,000 years with respect to population sizes of maximum urban areas, the upper lim it of approximately one million is not exceeded for any significant period of time and represents a sustainable cap over this segment of human history. The exceptions are in 200 CE when Rome had a population of approximately 1.2 million, as was also the case in 1000 CE and 1100 CE for Asian urban areas, and a maximum was reached in 1300 CE of 1.5 million. It might be argued that during the 13th century this upper lim it was exceeded. First, this is beyond the scope of Kemp's study but worth considering as per the following: my answer is yes, the lim it was exceeded with a maximum urban area population of approximately 1.5 million, but this only for a short period of time and with disastrous consequences as the title of Barbara Tuchman's (1987) book A Distant Mirror: The Calamitous 14th Century suggests. Thereafter until the beginning of the 19th century maximum urban area populations remained around one million, a period of 400 years. In other words, until the advent of the Industrial Re-volution, a revolution tapping into fossil fuels, the urban area maximum of approximately one million was maintained until a new source of energy could be exploited, the aforementioned fossil fuels.
Turning to the actual results of this study, it is clear that the survivorship curve produced is a smooth continuous one, more supporting evidence that the group of civilizations reported on by Kemp can be considered as a cohort. Given this and the structure of the curve itself, there is no question that the cohort of civilizations exhibits a specific survivorship pattern and that pattern is characteristically shaped like a Type I survivorship curve. What are the consequences of this?
Survivorship representation is all about how mortality affects the distribution of ages of entities in a given population or cohort, either individuals in a population, species in a cohort of species, or civilizations within their own cohort. In the case of Type I survivorship, mortality is low in early ages and in fact through most of the lifetime of the cohort. However, mortality increases precipitously in those civilizations with an extensive history. This pattern of mortality is characteristic of K-species, which have few offspring but invest significantly in the survivorship of their few offspring. Humans are examples of such species. [The symbols, r and K, are taken from the Verhulst Logistic equation, dN/dt = rN(1 – N/K), in which r = reproductive rate, and K = carrying capacity of the environment for the given population being represented.] Perhaps, it is unsurprising that human civilizations exhibit such a pattern of survivorship, however, one might ask why this is so. Human survivorship is a consequence not only of our immediate biology but also as a result of our ability to communicate and cooperate both with neighbors and people at extended distances and over extended periods of time, this latter as a function of our ability to store and later express information. That communication as a function of the civilization as a whole and how it is applied both endemically and also with other civilizations underwrites its own survivorship and that of other civilizations. Even so there are limits, and older civilizations, following the pattern of the Type I curve, have a reduced further survivorship; this is in distinction to Type III survivorship in which early mortality is high but in which later survivorship is (relatively) enhanced; with regard to humans, octogenarians have a reduced probability of reaching their nineties, but the equivalent-aged Tridacna, the giant clam of the Pacific, have a high probability of continuing life.
Joseph Tainter (1987) and more recently Ugo Bardi (2019) have provided a model for such a pattern of mortality, that of increasing and burdening civilizational complexity, which reaches a tipping point in which the civilization can no longer support itself. The Tainter model is symmetrical in which increased complexity first bring civilizational improvement, then a period of decreasing returns to increased complexity, and finally negative returns ultimately leading to collapse, however, the Bardi model, following the notions of the Latin philosopher, Seneca, and using this philosopher's name as the label of rapid demise, suggests that the consequence of increasing complexity will be one of slow and possibly steady accumulation followed by rapid civilization collapse. This pattern is in agreement with Type I survivorship. Also in accordance with this pattern is the fact that Type I survivorship has a long half-life, while Type III survivorship has a reduced half-life.
Concerning the actual Kemp data, these data represent a coherent set of civilization lifespans as shown in Figs 2 and 3. With respect to a rank-order distribution, an exponential decay curve gives an excellent fit for the entire set, having a very high coefficient of determination, R2 = .9885. This would imply, I believe, system self-organization (see Harper 2020). Such self-organization is characteristic of any number of natural systems, for example the organization of words on a page (Zipf 2012) or ecological succession, etc. and is a default consequence of the behavior of system agents within system constraints. One system constraint has already been mentioned: energy source. Energy availability should also be considered as a viable system constraint, the system in question being the collection of (interacting) civilizations identified by Kemp.
While self-organization is probably a default response to energy constraints, it was mentioned earlier that a significant portion of the Kemp data can be fitted to a linear regression with a slightly higher coefficient of determination, R2 = .9960. It is suggested here that this portion of the distribution is managed and not self-organized (Ibid.). Why? What follows is serious speculation... but at present, speculation only.
Fig. 2 shows that there are distinct gaps between the few civilizations with the longest lifespans and the remainder with consecutively shorter lifespans. As a potential topic of further research, it is a working hypothesis here that at least in part, the longer-lived civilizations might have had an effect on the durations of shorter-lived civilizations. This implies, of course, some sort of direct or indirect influence of the longer-lived civilizations on those of shorter duration. In other words, longer-lived civilizations are expected to have a non-random effect on the lifespans of those civilizations within their sphere of influence.
Figs 5 and 6 are the prime focus of this paper and show that the Kemp data, when organized as a single cohort, exhibit Type I survivorship for this particular data set. The graphs of both figures suggest that mortality (= extinction) of civilizations is reduced in the beginning and intermediate lifespans. This would seem to imply that once established young civilizations have a relatively high probability of surviving at least into middle age. Even though there are civilizations with very short lifespans, the Qin Dynasty being the shortest-lived civilization in the cohort at 14 years, with unique circumstances mediating their demise, on average, young civilizations have a future. This is not the case for older, more mature civilizations, and this is unquestionably supported by the theoretical positions of Tainter and Bardi; the burden of increasing complexity with decreasing beneficial returns on that increased complexity represents a cost, the magnitude of which can result in their collapse.
Extended survivorship, sometimes leading to senescence, always involves loss, both deterministic and stochastic. As an example of this latter source of loss, a simple model provided by Peter Medawar (1952) and more broadly explained by Paul Ormerod (2007) suggests that over time attrition occurs. Medawar uses a set of laboratory test tubes that over time become chipped and broken; a wedding gift China set suffers the same fate. However for biological entities, the form of loss is a consequence of underlying biology. In the case of human civilizations it is human cooperation and communication that produce Type I survivorship. This type of survivorship is enhanced by interaction within and between civilizations at levels of organization above that of the individual, for example at the level of political institutions.
For species that have Type I survivorship, the implication is that they fall into the category of K-species, which have a low reproductive rate but a high level of parenting, thus insuring that survivorship of offspring to reproductive maturity has an increased probability. What does this mean at the level of civilizational organizations, as civilizations, per se, do not reproduce? Certainly this is so, but civilizations do persist and sustain, and this persistence and sustainability requires endemic parenting if you will, that is collaboration and cooperation between entities within a given civilization directed toward civilization maintenance that will result in civilizational persistence through time. However, one should also remember that this necessary collaboration and cooperation result in the increasing burden of complexity.
(A short note here is given to establish the fact that causes external to any civilization, for example environmental downturns, volcanism, earthquakes, and unwanted visitors from beyond our planet's boundaries, can also result in civilizational collapse. The civilizational margin of error, measured in the robustness and resilience of that civilization, may be a determining factor here, but only within a small range of limits, as regardless of the extent of that margin of error, volcanism of the magnitude of a Tambora, Krakatoa, or Toba will take its toll.)
If civilizational survivorship patterns fall within the class of a K-species, i.e. that maintenance of single civilizations occurs rather than the proliferation of sister civilizations, then there are other consequences that need to be considered. A primary concern is energy consumption, and recalling that civilizational complexity increases with time, this implying, under the assumption that energy consumption and complexity of civilizations is directly proportional, that energy use also increases. It also implies in comparison with Type III survivorship patterns that maintenance and growth of a single civilization through to a ‘late’ half-life will require considerably more energy than the same task for
Type III distributions. It can also be assumed that more younger and middle-aged civilizations will exist at any given time and therefore that the energy consumed will be largely devoted to increasing civilizational complexity and in turn receiving positive returns for the increased complexity. Regarding the efficiency of energy use, efficiency being defined as CBROI (complexity benefit return on investment), not to be confused with EROI (energy return on investment) (in the oil industry and elsewhere), then CBROI will increase, initially, that is during the early phases of civilization development, with a positive rate and then with a declining rate until the Seneca Effect occurs at which point CBROI becomes negative. Several important questions to be addressed by further research would be:
1. At any given point over the 4,000 years of Kemp's study, what is the fraction of short-lived versus long-lived civilizations, and what does this mean for the energy budget of the world-system as a whole? Note that short-lived civilizations would presumably be in a state of very positive CBROI.
2. Is there a scaling effect for urban area sizes? And, of course, there is (see Bettencourt 2022), then it can be shown that in comparison with one large urban area that the energy requirements of a number of smaller urban areas, the sum of which is equivalent in population size, actually be greater than the single large urban area.
3. Given that the answer, not yet proven, is in the affirmative, then do the Zipf-Pareto distributions that fit urban area distributions represent optimal distributions with respect to energy availability?
Civilizations also have associated with them characteristic information in terms of associated entropy (see Harper In press). It can be shown that for the system as a whole and with regard to the size of maximum urban area populations (Cmax), given the acceptance of the following three differential equation models: dN/dt = rN(1 – K), dK/dt = (T – N)/K, and dT/dt = T/(K – N), and the application of the continuous form of the Shannon Equation: H = –∫f(x)lnf(x)dx, it can be shown that entropy declines to a minimum either in synchrony with or one time step prior to a phase of punctuational growth in Cmax. What then is the relationship between entropy and individual civilizational growth?
If one takes a look at the pattern of maximum urban area population sizes over time, it can be shown that changes in Cmax occur either as a shift from a period of stasis to a period of punctuated growth or from a period of punctuation to one of stasis. I am excluding here any fluctuations about a stasis mean that may be the result of both internal or external factors, for example climate-change-motivated changes, or the cascading effects of the same. Also, it should be noted that the advent of civilizations and their demise, irrespective of size, occur during both phases of punctuation and stasis, so, what is being proposed here is a very provisional first step in associating energy changes (somewhat indirectly) with civilizational changes as they might be associated with changes in maximum urban area populations, this latter being used as a measure of the upper limits of energy availability.
I consider the shift from stasis to punctuation as a consequence of either the access of a new energy source, for example the Industrial Revolution, or better access and more efficient use of an already present energy source, both by technological improvements. Further, I would like to suggest, following the work of Padgett and Powell (2012) that in either case the mechanisms involved require the formation of hypercycle relationships (Harper In press), the functional parts of which are already available. It is particularly interesting that, if the three- differential-equation-model of change over time is to be taken seriously, this event of hypercycle formation occurs at or near, one time step prior to the beginning of a technological phase of punctuation. Note also that the punctuational changes in both population and technology occur synchronously with respect to the model and are model predictions that should be tested empirically.
What about the transition from a phase of punctuation to a phase of stasis with respect to that changes effect on energy availability and civilizational lifespan? This is an area of research that I can only very loosely speculate about. The real issue is to consider the origin of various civilizations in Kemp's data set with respect to the phases of punctuation and stasis and make comparisons with respect to civilizational longevity. It is interesting, however, that the survivorship curve produced from this data, which spans portions of two phases of punctuation and three phases of stasis, is essentially smooth and continuous. Given this and the question with which this paragraph began, it can only be assumed (for the moment) that the establishment of an upper lim it in the form of a maximum urban area population size, i.e. occurring at or near an entropy maximum, may have some consequences for civilization bridging this transition, possibly resulting in the demise of some due to their inability to adjust to upper limits of energy availability as cued by maximum urban area population size. As an example of the effect of this transition from punctuation to stasis, note that Rome achieved a size of about one million in 100 BCE, and with some (considerable) fluctuations, that size was maintained over the next seventeen hundred years. One should also note that the Roman Republic ended at this time.
In brief, the energy relationships with respect to civilizational lifespans are speculative, but, given that a periodization of history with respect to maximum urban area population magnitude can be established, it appears that the transitions from one phase to the other may represent a signature time to consider energy relationships with extant civilizations at that time. It is further suggested that, at least with respect to the transition from stasis to punctuation, the process of hypercycle formation may represent a reasonable mechanism for such a transition and therefore be associated with the initiation of (some) civilizations. This transitional process is associated with a decrease in entropy with respect to predictions of the three equation models. The reverse may not be said of the transition from punctuation to stasis; this is more Malthusian in nature.
It is worthwhile to discuss here what the future holds for the implications of this notion that civilizations have a Type I survivorship curve. First of all, with regard to Kemp's study the future begins at 1000 CE, but this future must also be considered from the perspective of our own future, first into the rest of the 21st сentury and then beyond. Based on Kemp's data and as noted earlier, the half-life of preindustrial civilizations is approximately 840 years. From an actuarial perspective this suggests that civilizations* like the U.S. have the potential for a further somewhat unfettered existence, while those civilizations currently in existence for a longer period of time, especially those approaching the age of 840 years, will have less so; the farther end of a Type I survivorship curve will, from an actuarial view, have a an emphatically curtailing effect on further civilizational existence.
While an actuarial perspective with regard to civilization lifespan provides a logical position concerning the predictive value of further existence of those civilizations, contextual evidence is also important. Regarding the time period beyond 1000 CE, three major events that have influenced humanity stand out: the Black Death of the 14th century, the Industrial Revolution that began in the 18th century, and the current information technology revolution that has begun in the 20th century and is still ongoing. Since the Black Death occurred during a time when agrarian surplus established the limits of civilizations, it might be assumed that any data set of civilization lifespans extending beyond 1000 CE but ending before approximately 1750 CE would have a similar Type I shape; in fact were data of this sort simply added to the already existing pool, it is quite possible that no significant change in shape, other than increasing the individual temporal class sizes would occur. However, the Industrial Revolution and the ongoing Techno-Information Revolution present very different problems; the former involves access to a new energy source, and the latter represents an improved and more efficient use of information already present but also has the potential to reveal yet other energy sources, and both are of (very) recent origin. So, there is no actual way to access new data into the future. However, risky as it might be, I would like to make a prediction regarding the shape of such civilizational survivorship curves. The Type I curve represents circumstances in which there is (enhanced) communication and cooperation between the members of the data set. Both of these revolutions represent the potential for further enhanced cooperation. As a consequence, there will be no transition of civilizational lifespan pattern from a Type I curve to anything else, that is there will be no transition to a Type II or III curve, but, and this is a conjunction of significant meaning, there may well be a steeper descent to extinction beyond the half-life point; the half-life point will also be extended beyond what it is for Kemp's data. The current state of the world-system is fragile and with increasing fragility into the foreseeable future. The consequences of this increasing fragility will dwarf the fragility associated with the two world wars of the previous century and could very easily do so for the Black Death, and ultimately be an historical hallmark test of our ability to cooperate with one another. The current literature on this is both voluminous and depressing (see, e.g., Homer-Dixon 2010; Bardi 2019a) to list just a few thoughtful examples.
Summary and Conclusions
1. It has been established that civilizations exhibit a clearly defined survivorship pattern.
2. Support for the statement in #1 is a consequence of the fact that the data set in question can be interpreted as representing a cohort which is a necessary condition for survivorship analysis. Specifically, this evidence takes the form of both a cohesive rank – order curve and a characteristic survivorship curve.
3. This pattern is characteristic of Type I survivorship.
4. The rank-order curve has both an overall Zipf-Pareto-like pattern and also an internally embedded linear pattern.
5. That the civilizations in the Kemp data set exhibit a Type I survivorship pattern has several consequences:
a. The mortality, that is extinction rate, of relatively young civilizations is reduced.
b. Implied in the reduced extinction rate of young civilizations is the presence of enhanced communication and cooperation by the members of a given civilization both at the individual level and the institutional level.
c. Older civilizations have a reduced potential for continued survivorship.
d. The half-life of such patterns occurs relatively close to the extinction point of the civilization cohort.
e. It comes as no surprise that a Type I association for human civilizations implies that humans are a K-species. The aforementioned enhanced communication and cooperation between sub-entities of a given civilization is supporting evidence for this assertion.
f. The work of Tainter (1987) and Bardi (2019b) are in support of Type I survivorship, as, in particular, Bardi's work implies not just an extinction point due to the burden of increasing civilizational complexity but a Seneca effect, that is shortly after the zenith of a given civilization that civilization may/will rapidly extinguish.
6. External causes, volcanism, earthquakes, etc., may terminate civilizations regardless of age.
7. Energy relationships and mode of survivorship are briefly discussed with the intent to bring to light the potential for further research in the relationship between changes from stasis to punctuation and punctuation and the type of survivorship characteristic of civilizations.
References
Bardi U. 2019a. Before the Collapse: A Guide to the Other Side of Growth. New York: Springer.
Bardi U. 2019b. The Lifespans of Ancient Civilisations. BBC Future. February 19.
Bettencourt L. 2022. Introduction to Urban Science: Evidence and Theory of Cities as Complex Systems. Boston: MIT Press.
Deevey E. 1947. Life Tables for Natural Populations of Animals. Quarterly Review of Biology 22(4): 283–314.
Gotelli N. 2008. A Primer of Ecology. 4th Ed. New York: Sinauer Associates.
Hutchinson G. 1978. An Introduction to Population Ecology. New Haven: Yale University Press.
Harper A. 2017. The Punctuated Equilibrium Macropattern of World System Urbanization and the Factors that Give Rise to that Macropattern. Social Evolution and History 16(1): 86–127.
Harper A. 2020. A Quantitative Analysis of Reign Lengths of Pre- and Post-Taifa Periods and Taifa Kingdom Durations during the Existence of Al Andalus. History and Mathematics: Investigating the Past and Future / Ed. by L. Grinin, and A. Korotayev, pp. 11–29. Volgograd: Uchitel Publishing House.
Harper A. In Press. The Integration of Two Disparate Processes: Punctuated Equilibria Characterize Urbanization over Time, While Kondratief Long Waves Characterize Long Term Economic Change.
Homer-Dixon T. 2010. The Upside of Down: Catastrophe, Creativity, and the Renewal of Civilization. Washington, D.C.: Island Press.
Kemp L. 2019. Are We on the Road to Civilization Collapse? BBC. February, 19.
Linotte D. 2020. The Duration of Civilizations: Preliminary Recalculations (A Short Note). International Journal of Humanities and Social Science Invention (IJHSSI): 9(7): 10–13.
Medawar P. 1952. An Unsolved Problem of Biology. London: H. K. Lewis and Company.
Ormerod P. 2007. Why Most Things Fail: Evolution, Extinction, and Economics. New York: Pantheon.
Padgett J., and Powell W. 2012. The Emergence of Organizations and Markets. Princeton: Princeton University Press.
Tainter J. 1987. The Collapse of Complex Societies. New York: Cambridge University Press.
Tuchman B. 1987. A Distant Mirror: The Calamitous 14th Century. New York: Random House Publishing Group.
Wilson E., and Bossert W. 1971. A Primer of Population Biology. New York: Sinauer Associates.
Zipf G. 1949[2012]. Human Behavior and the Principle of Least Effort: An Introduction to Human Ecology. Eastford, CT: Martino Fine Books.
* Please note that the term ‘civilization’ is being used quite loosely here. The definitions of this word are numerous: a civilization is the development of a society; a society with complementary social institutions; a complex society, and the list goes on. For the purposes of this paper, civilization means a unitary and complex society; one with shared values which may or may not have a spiritual component; this is however not very definitive. The late Supreme Court Justice Black, when confronted with the question of what pornography is suggested that he did not know how to define it but knew it when he saw it. I would like to take the same position here with regard to defining the term ‘civilization’.